Fixation probabilities and Invasion diagram
In this notebook we analyse the Stochastic dynamics of (pairwise) social imitation under the small mutation limit (SML)
[1]:
import os
[2]:
import numpy as np
import matplotlib.pyplot as plt
import egttools as egt
%matplotlib inline
[3]:
egt.Random.init()
seed = egt.Random._seed
Payoff matrix for a Normal Form Game
Here we will analyse a Normal Form game, so we need to first define a payoff matrix
[4]:
T=4; R=2; P=1; S=0
A = np.array([
    [P, T],
    [S, R]
])
Select which strategies we want to analyse
We can add all the strategies to a list and pass it to the Game object
[5]:
strategies = [egt.behaviors.NormalForm.TwoActions.Cooperator(),
              egt.behaviors.NormalForm.TwoActions.Defector(),
              egt.behaviors.NormalForm.TwoActions.TFT(),
              egt.behaviors.NormalForm.TwoActions.Pavlov(),
              egt.behaviors.NormalForm.TwoActions.Random(),
              egt.behaviors.NormalForm.TwoActions.GRIM()]
[6]:
strategy_labels = [strategy.type().replace("NFGStrategies::", '') for strategy in strategies]
[7]:
strategy_labels
[7]:
['AllC', 'AllD', 'TFT', 'Pavlov', 'Random', 'GRIM']
Instantiate the Normal Form Game
Now we can instanciate the Game and pass both the strategies and the payoff matrix
[8]:
game = egt.games.NormalFormGame(100, A, strategies)
Now we instanciate the StochDynamics class to perform analytical calculations
We pass the expected payoffs calculated by the NormalFormGame class
[9]:
Z= 100; beta=1
evolver = egt.analytical.PairwiseComparison(Z, game)
[10]:
transition_matrix,fixation_probabilities = evolver.calculate_transition_and_fixation_matrix_sml(beta)
stationary_distribution = egt.utils.calculate_stationary_distribution(transition_matrix.transpose())
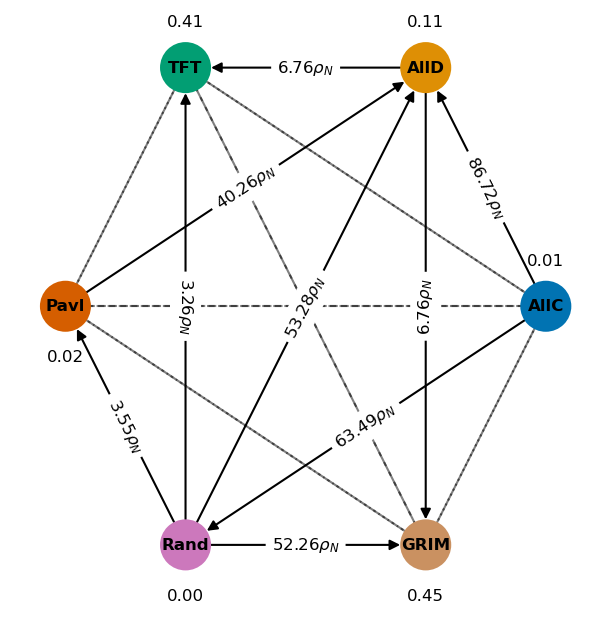
Plot invasion diagram
[11]:
fig, ax = plt.subplots(figsize=(5, 5), dpi=150)
G = egt.plotting.draw_invasion_diagram(strategy_labels,
                                              1/Z, fixation_probabilities, stationary_distribution,
                                              node_size=600,
                                              font_size_node_labels=8,
                                              font_size_edge_labels=8,
                                              font_size_sd_labels=8,
                                              edge_width=1,
                                              min_strategy_frequency=0.00001,
                                              ax=ax)
plt.axis('off')
plt.show() # display
[ ]: